ImpactSustainability6 MIN READ

Wind and Solar Supplied 20% of US Electricity in H1 2026, Output Up 10% Year-on-Year

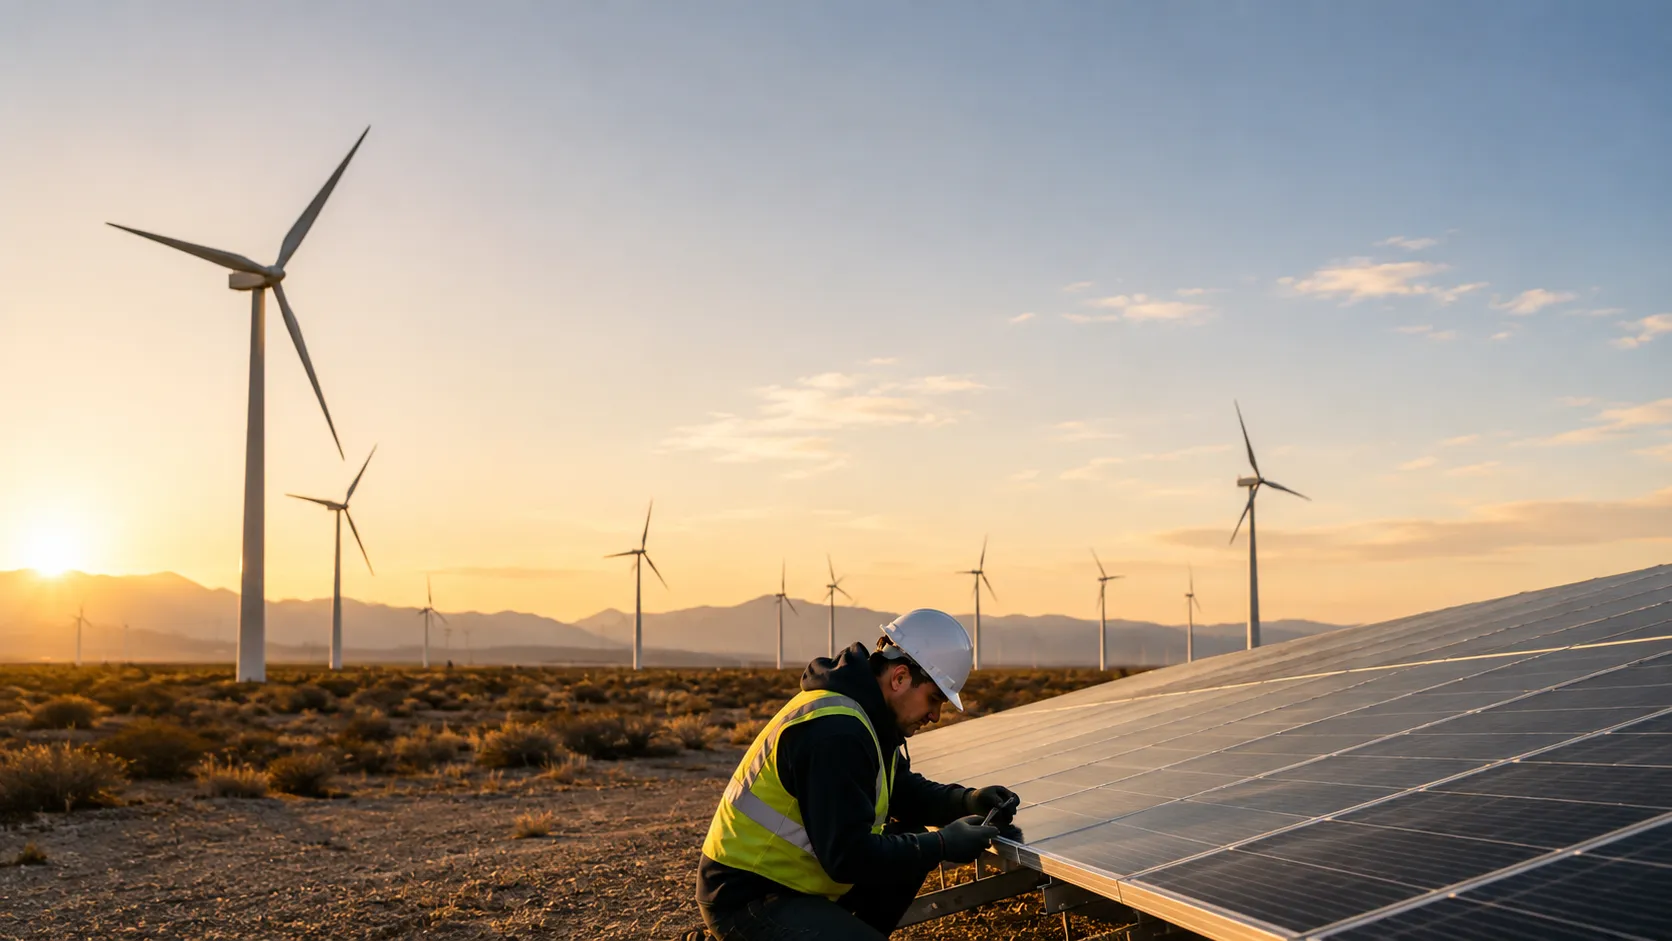
Wind and solar power supplied 20 percent of US electricity generation during the first half of 2026, producing nearly 420 terawatt-hours combined and surpassing both nuclear and coal for the first time across a comparable period.

By Nisha Omkumar · Author2 September 2026New
Wind and Solar Supplied 20% of US Electricity in H1 2026, Output Up 10% Year-on-Year

Wind and solar power together supplied 20 percent of total US electricity generation during the first half of 2026, according to figures reported on August 31, generating nearly 420 terawatt-hours of combined output and marking a milestone moment in which the two renewable sources collectively surpassed both nuclear and coal generation across the same period. The data reflects continued acceleration in the pace of America's electricity-generation transition, even amid ongoing political and regulatory debate around the trajectory of the country's broader clean-energy policy.

Combined wind and solar output rose 10 percent year-on-year during the period, a growth rate that outpaced overall electricity-demand growth and reflects continued capacity additions across both technologies despite a policy environment that has grown notably more complex and, in certain respects, less consistently supportive of renewable-energy development compared to prior years. The sustained growth trajectory suggests that underlying economic factors — including the falling cost of solar and wind generation relative to conventional fuel sources — continue to drive deployment independent of shifting political winds around clean-energy subsidies and incentives.

Nuclear power generated approximately 390 terawatt-hours across the same first-half period, positioning wind and solar's combined 420 terawatt-hours slightly ahead of the historically steady, always-on baseload power that nuclear generation has traditionally provided to the US grid. This relative positioning marks a symbolically significant threshold, given nuclear power's longstanding status as a dependable, high-capacity-factor generation source that renewable advocates and sceptics alike have frequently used as a benchmark for evaluating the practical scale renewable sources have achieved within the broader US generation mix.

The milestone arrives amid an increasingly complex US energy-policy landscape, with federal policy signals around clean-energy incentives, transmission infrastructure development and permitting reform sending sometimes conflicting messages to renewable-energy developers and investors. Despite this policy uncertainty, the underlying economics of wind and solar generation — now frequently the cheapest sources of new electricity generation capacity in many US regions — have continued to drive substantial capacity additions, suggesting market-driven deployment momentum that extends beyond any single administration's policy priorities.

This growth in renewable generation arrives precisely as US electricity demand faces unprecedented upward pressure from several converging sources: the rapid expansion of AI-driven data-centre infrastructure, continued electrification of transportation and heating systems, and broader industrial electrification trends. This confluence of rising demand and expanding renewable supply has created both significant opportunities and substantial grid-management challenges, as utilities work to integrate variable renewable generation at increasing scale while simultaneously accommodating rapidly growing baseline electricity consumption.
image.png

The data also carries important implications for how policymakers, utilities and investors think about the pace and shape of America's broader electricity-generation transition. Wind and solar's ability to collectively surpass nuclear generation output — even as coal generation continues its long-term secular decline — suggests the renewable-energy transition within US electricity markets has reached a scale where it materially influences overall grid composition, rather than remaining a comparatively marginal contributor to the broader generation mix.


Wind and solar edging past nuclear output for the first time isn't a symbolic milestone — it's evidence the US generation mix has genuinely shifted.
TIGI Sustainability Desk

As the second half of 2026 unfolds, industry observers will watch closely whether wind and solar's combined growth trajectory can sustain its current pace, particularly given ongoing uncertainty around federal renewable-energy policy, evolving grid-interconnection queue backlogs that have slowed project development timelines in several US regions, and the increasingly urgent question of how quickly grid infrastructure itself can be modernised to accommodate continued renewable-capacity growth alongside surging overall electricity demand.

Regional variation across the United States remains substantial, with states such as Texas, California and Iowa continuing to lead national wind and solar generation figures by a considerable margin, while other regions lag well behind the national average due to a combination of policy environment, grid-interconnection capacity and resource availability differences. This uneven geographic distribution means the national 20 percent figure masks considerably higher renewable-generation shares in leading states, alongside regions where renewable adoption continues to trail national trends significantly.

The data also carries implications for corporate renewable-energy procurement strategies, as growing numbers of major US corporations — particularly technology companies operating energy-intensive data-centre infrastructure — have committed to substantial renewable-energy purchasing targets as part of broader sustainability and, in many cases, cost-management strategies given the increasingly competitive economics of wind and solar relative to conventional generation sources in many US electricity markets.

Grid-integration challenges remain the most significant practical constraint on continued renewable-capacity growth, with interconnection-queue backlogs in several US regions now extending several years from initial project application to actual grid connection — a bottleneck that industry analysts increasingly identify as a more binding constraint on renewable deployment than either technology cost or underlying investor capital availability. Addressing this interconnection bottleneck through regulatory reform and grid-infrastructure investment has become an increasingly urgent policy priority across multiple US states and at the federal regulatory level.

The milestone also carries international resonance, as several other major economies closely track US renewable-generation trends when calibrating their own domestic energy-transition policies and timelines. Wind and solar's demonstrated ability to scale to material shares of total generation within one of the world's largest and most complex electricity markets offers a useful reference point for policymakers in other countries navigating similar questions about the practical achievable pace of renewable-energy transition within their own grid infrastructure and regulatory constraints.

Ultimately, the first-half 2026 figures offer a data point that both renewable-energy advocates and sceptics are likely to cite selectively in the ongoing policy debate over America's energy future — proponents pointing to demonstrated scale and continued growth momentum, and sceptics highlighting the persistent grid-integration and reliability questions that remain to be fully resolved as the transition continues.

TagsRenewable EnergyWindSolarUnited StatesSustainabilityClean EnergyImpact

Reader reviews

Sign in to rate and review this article.
Loading reviews…